The 2026 FIFA World Cup will be hosted across Canada, Mexico, and the United States, which will be the first edition with 48 participating nations, organised into 12 groups of 4 teams. The expanded format raises the stakes for group-stage performance and gives more nations a seat at the biggest table in football.
This post explores squad composition and quality from a market-value perspective, using data scraped from Transfermarkt as of June 5, 2026. For each squad, the 26 highest-valued players are considered (matching the official maximum squad size). The analysis is broken into two parts:
Distribution of market values across all 48 squads, grouped by their tournament group.
Big 5 league exposure vs. squad quality, with group difficulty encoded as point size.
1. Squad Market Value by Group
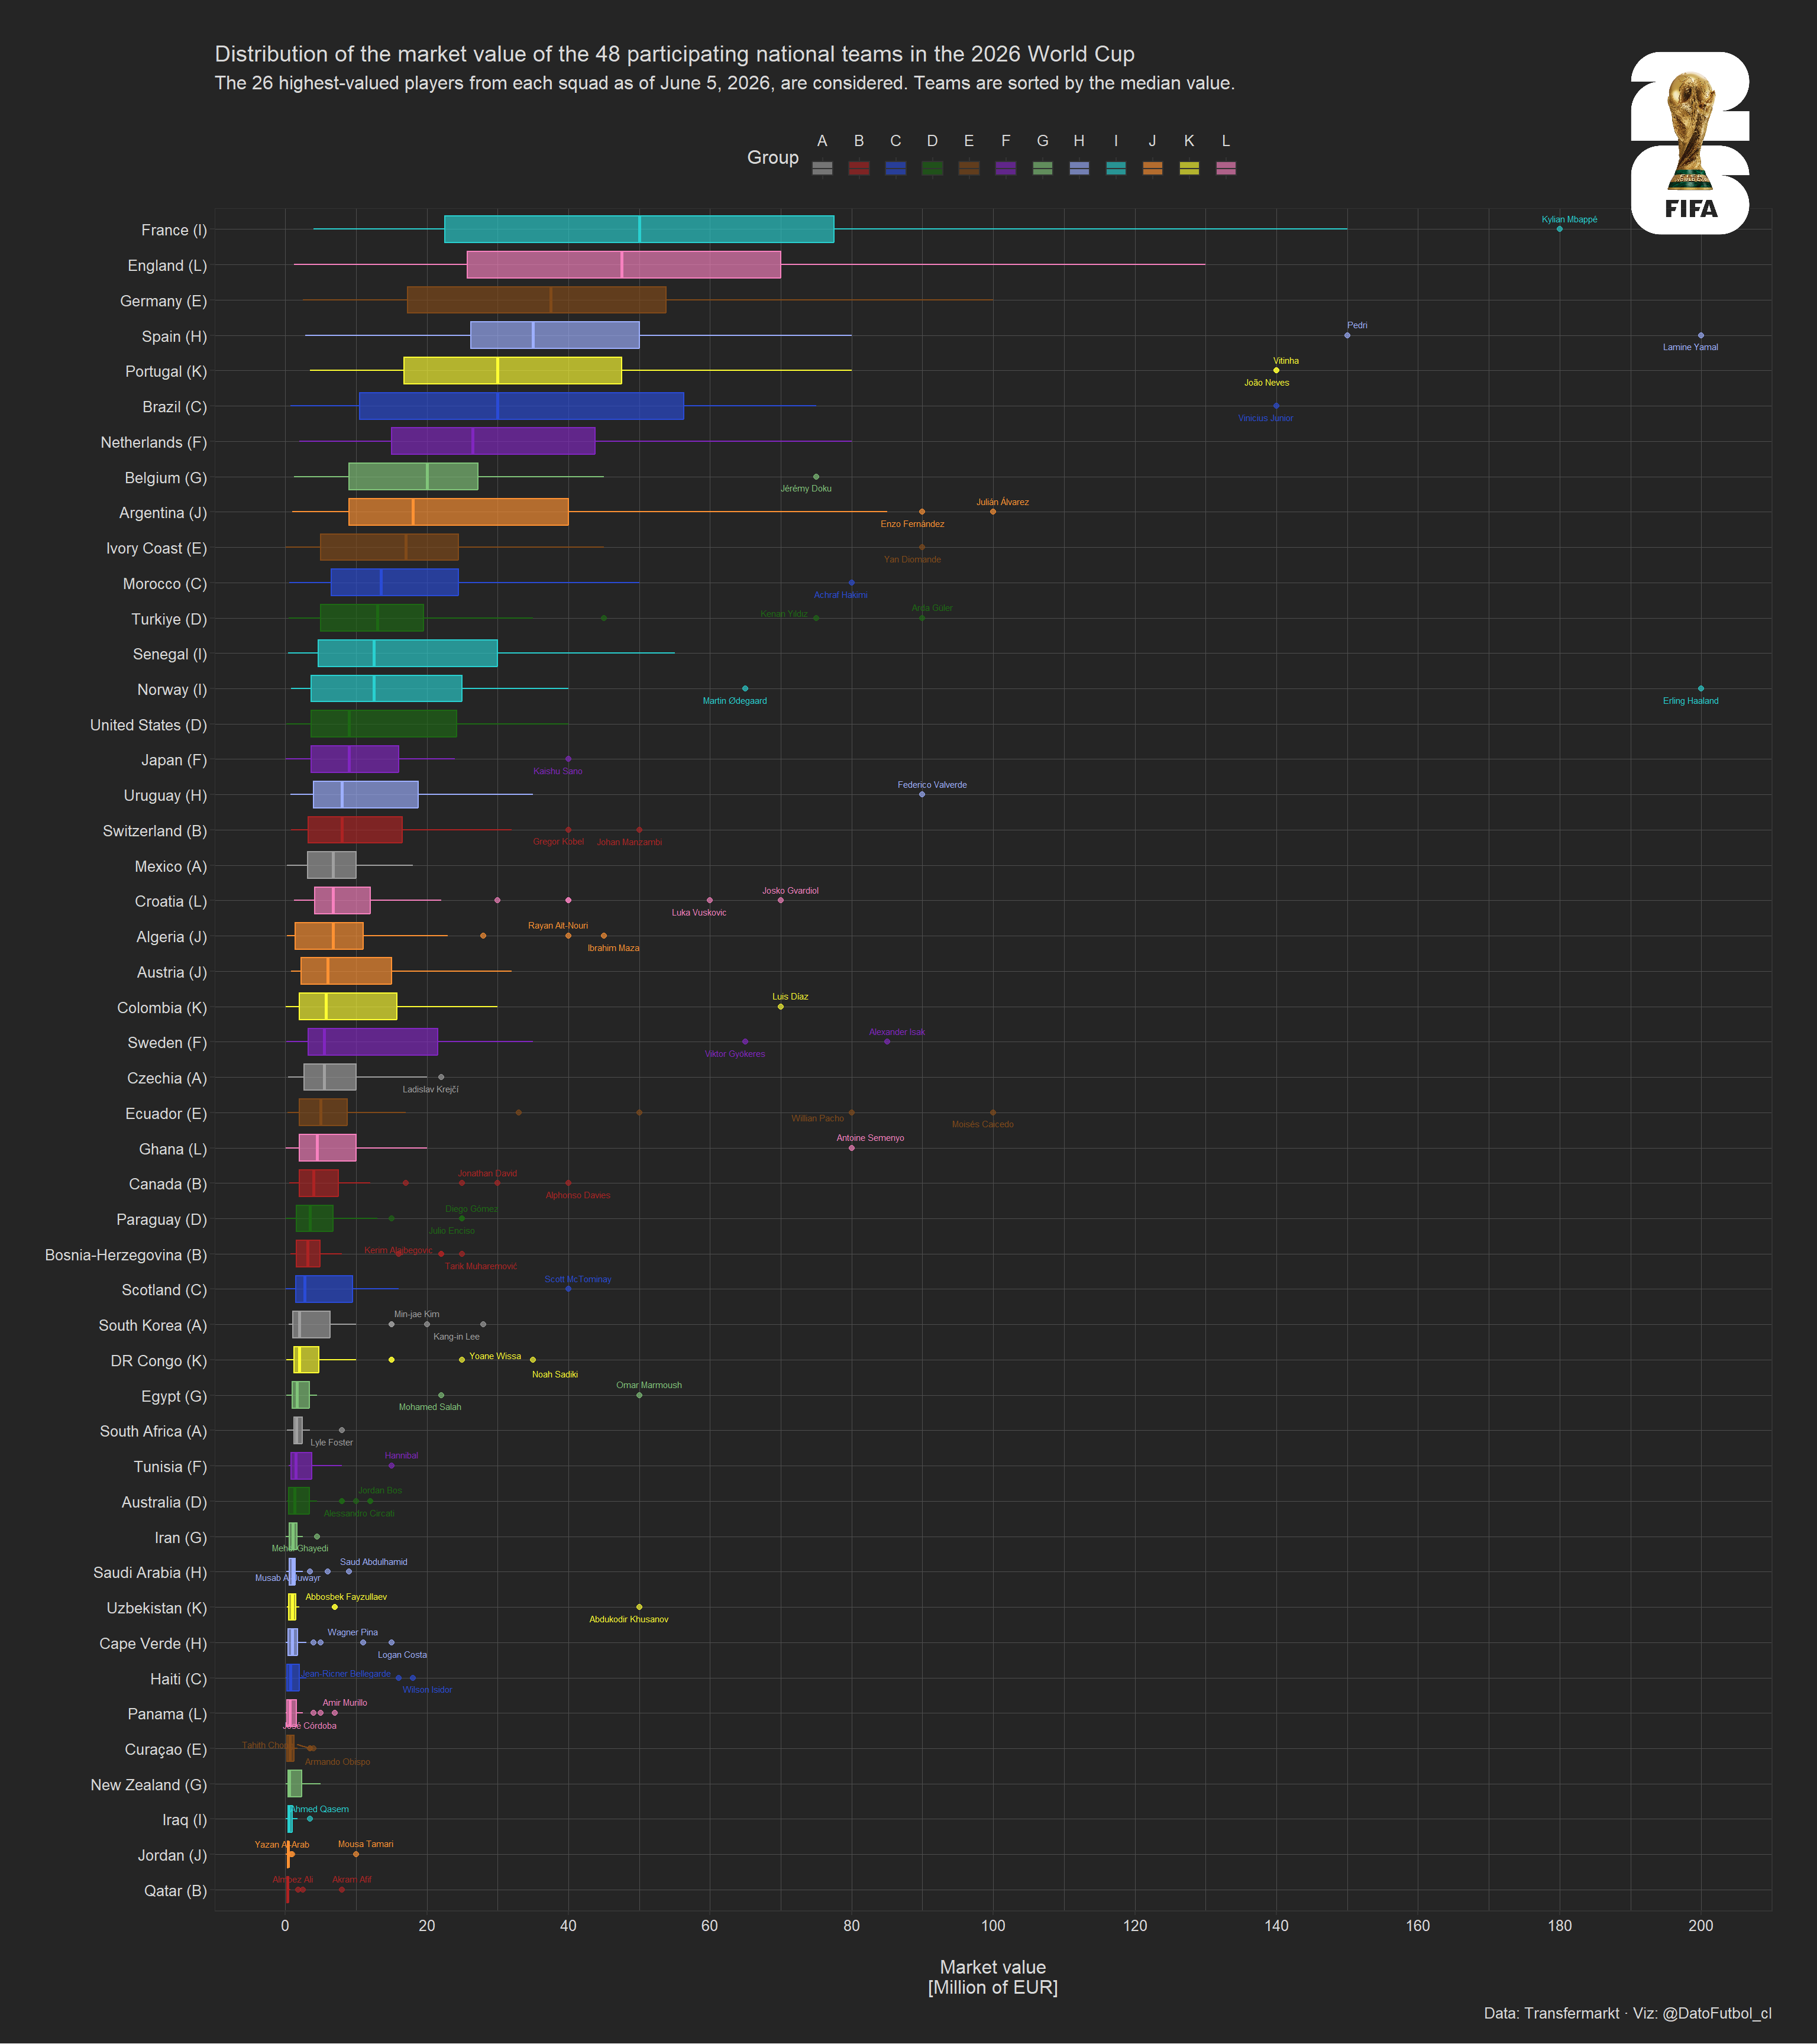
The boxplot below shows the distribution of individual player market values (in millions of euros) for each of the 48 squads. Teams are sorted by median squad value, and colours identify the group. Labels are added for the top outlier: the highest-valued players who stand well above their squad’s interquartile range.
The gap between the wealthiest and weakest squads is striking. France, England, Germany, and Spain sit at the very top with median player values well above €30M, while several debut nations (Haiti, Iraq, Jordan, and Cape Verde) field squads with median values below €1M.
To measure how lopsided each group is, we compute the Gini coefficient of the four teams’ median squad values within each group — the same inequality metric used for income distributions, here applied to squad wealth. A high Gini means one or two teams tower over the rest on paper; a low Gini means the four squads are closely matched in value.
Groups G (Belgium, Egypt, Iran, New Zealand), H (Spain, Cape Verde, Saudi Arabia, Uruguay), and L (England, Croatia, Ghana, Panama) come out as the most lopsided, each anchored by one clearly dominant squad facing three far cheaper sides.
At the other extreme, groups A (Mexico, South Africa, South Korea, Czechia), D (United States, Paraguay, Australia, Turkiye), and B (Canada, Bosnia-Herzegovina, Qatar, Switzerland) are the most evenly matched, with the lowest Gini coefficients among their teams’ median squad values, suggesting tighter, more unpredictable group races.
2. Big 5 League Share vs. Squad Quality
A key structural advantage for wealthier nations is club affiliation: players who compete week-in, week-out at the highest club level tend to be match-sharp and battle-tested. The five biggest European leagues (Premier League, La Liga, Bundesliga, Serie A, and Ligue 1) serve as a proxy for that competitive exposure.
The scatterplot below shows each team’s share of players from Big 5 leagues (x-axis) against their mean player market value (y-axis). Point size encodes a composite group-difficulty index built from the average opponent squad value and Big 5 share (each normalised 0–1 and equally weighted). Hover over a point for full squad and group stats.
The strong positive correlation (r ≈ 0.82) confirms that Big 5 exposure and squad quality go hand in hand. Nations like France, England, Spain, and Portugal cluster in the top-right corner: both highly valued and almost entirely composed of Big 5-based players. By contrast, co-hosts United States, Canada, and Mexico occupy interesting positions — decent Big 5 shares relative to their squad values, facing a moderately difficult group path. The largest points indicate teams facing the toughest average opponents; smaller points signal an easier draw.
The table below ranks all 48 teams by edge: their own composite index (own squad value + Big 5 share, normalised 0–1) minus the composite index of their average group opponent. A large positive edge means a team is stronger on paper than the teams it will face; a large negative edge flags a team punching below its group.