One of the main factors that have enhanced the significant development of Football Analytics in recent years is the open data made by StatsBomb.
Their Open Data project includes event data from more than 3000 games (as of September 2023) from 18 different tournaments, such as the Men/Women FIFA World Cups, UEFA Euro, Premier League, Champions League, La Liga, Serie A, Bundesliga, Ligue 1 and more.
Furthermore, some of these games have 360-degree data that includes positional information related to off-ball players for each event (more details, click here
In this brief post, I will share an R code with you to get this data using the package {StatsbombR}, which was created by the same company.
Installing {StatsBombR}
You might have encountered some challenges with this initial step, even if followed the official instructions. If that is the case, I hope to provide you with potential solutions here.
Open RStudio and follow these steps:
Please make sure you are using R version 3.6.2 or later before attempting to install
If not yet installed into R, run: install.packages("devtools") & install.packages("tidyverse")
Also run: devtools::install_github("Bustami/SDMTools-1.1-221")
Then, install the package as follows: devtools::install_github("statsbomb/StatsBombR")
Finally, load the package with library(StatsBombR)
Getting the data
Now, you can start retrieving the data:
Show code
# load the packagelibrary(StatsBombR)# get the table with the available competitionscompetitions =FreeCompetitions()# choose a specific one: in this case Qatar 2022qatar = competitions %>%filter(competition_name =="FIFA World Cup"& season_name =="2022")# get the games of Qatar World Cupqatar_games =FreeMatches(qatar)# get the eventing data of those gamesqatar_eventing =free_allevents(qatar_games)# clean/process some useful columns# (e.g. split X,Y coordinates info into two separated columns)qatar_eventing_clean =allclean(qatar_eventing)# store data in CSV format# (this way next time you won't have to run all the code but read the CSV file)library(readr)write_csv(qatar_eventing_clean, "eventing_data_qatar_2022_statsbomb.csv")# Also you can get the minutes played for each player in each game# (it is useful to obtain metrics values per 90 minutes played)players_minutes_played_per_game_qatar =get.minutesplayed(qatar_eventing_clean)
Ready!
Now you are able to explore this valuable eventing data resource.
In case you would like to take a course or customized lessons check my online courses section.
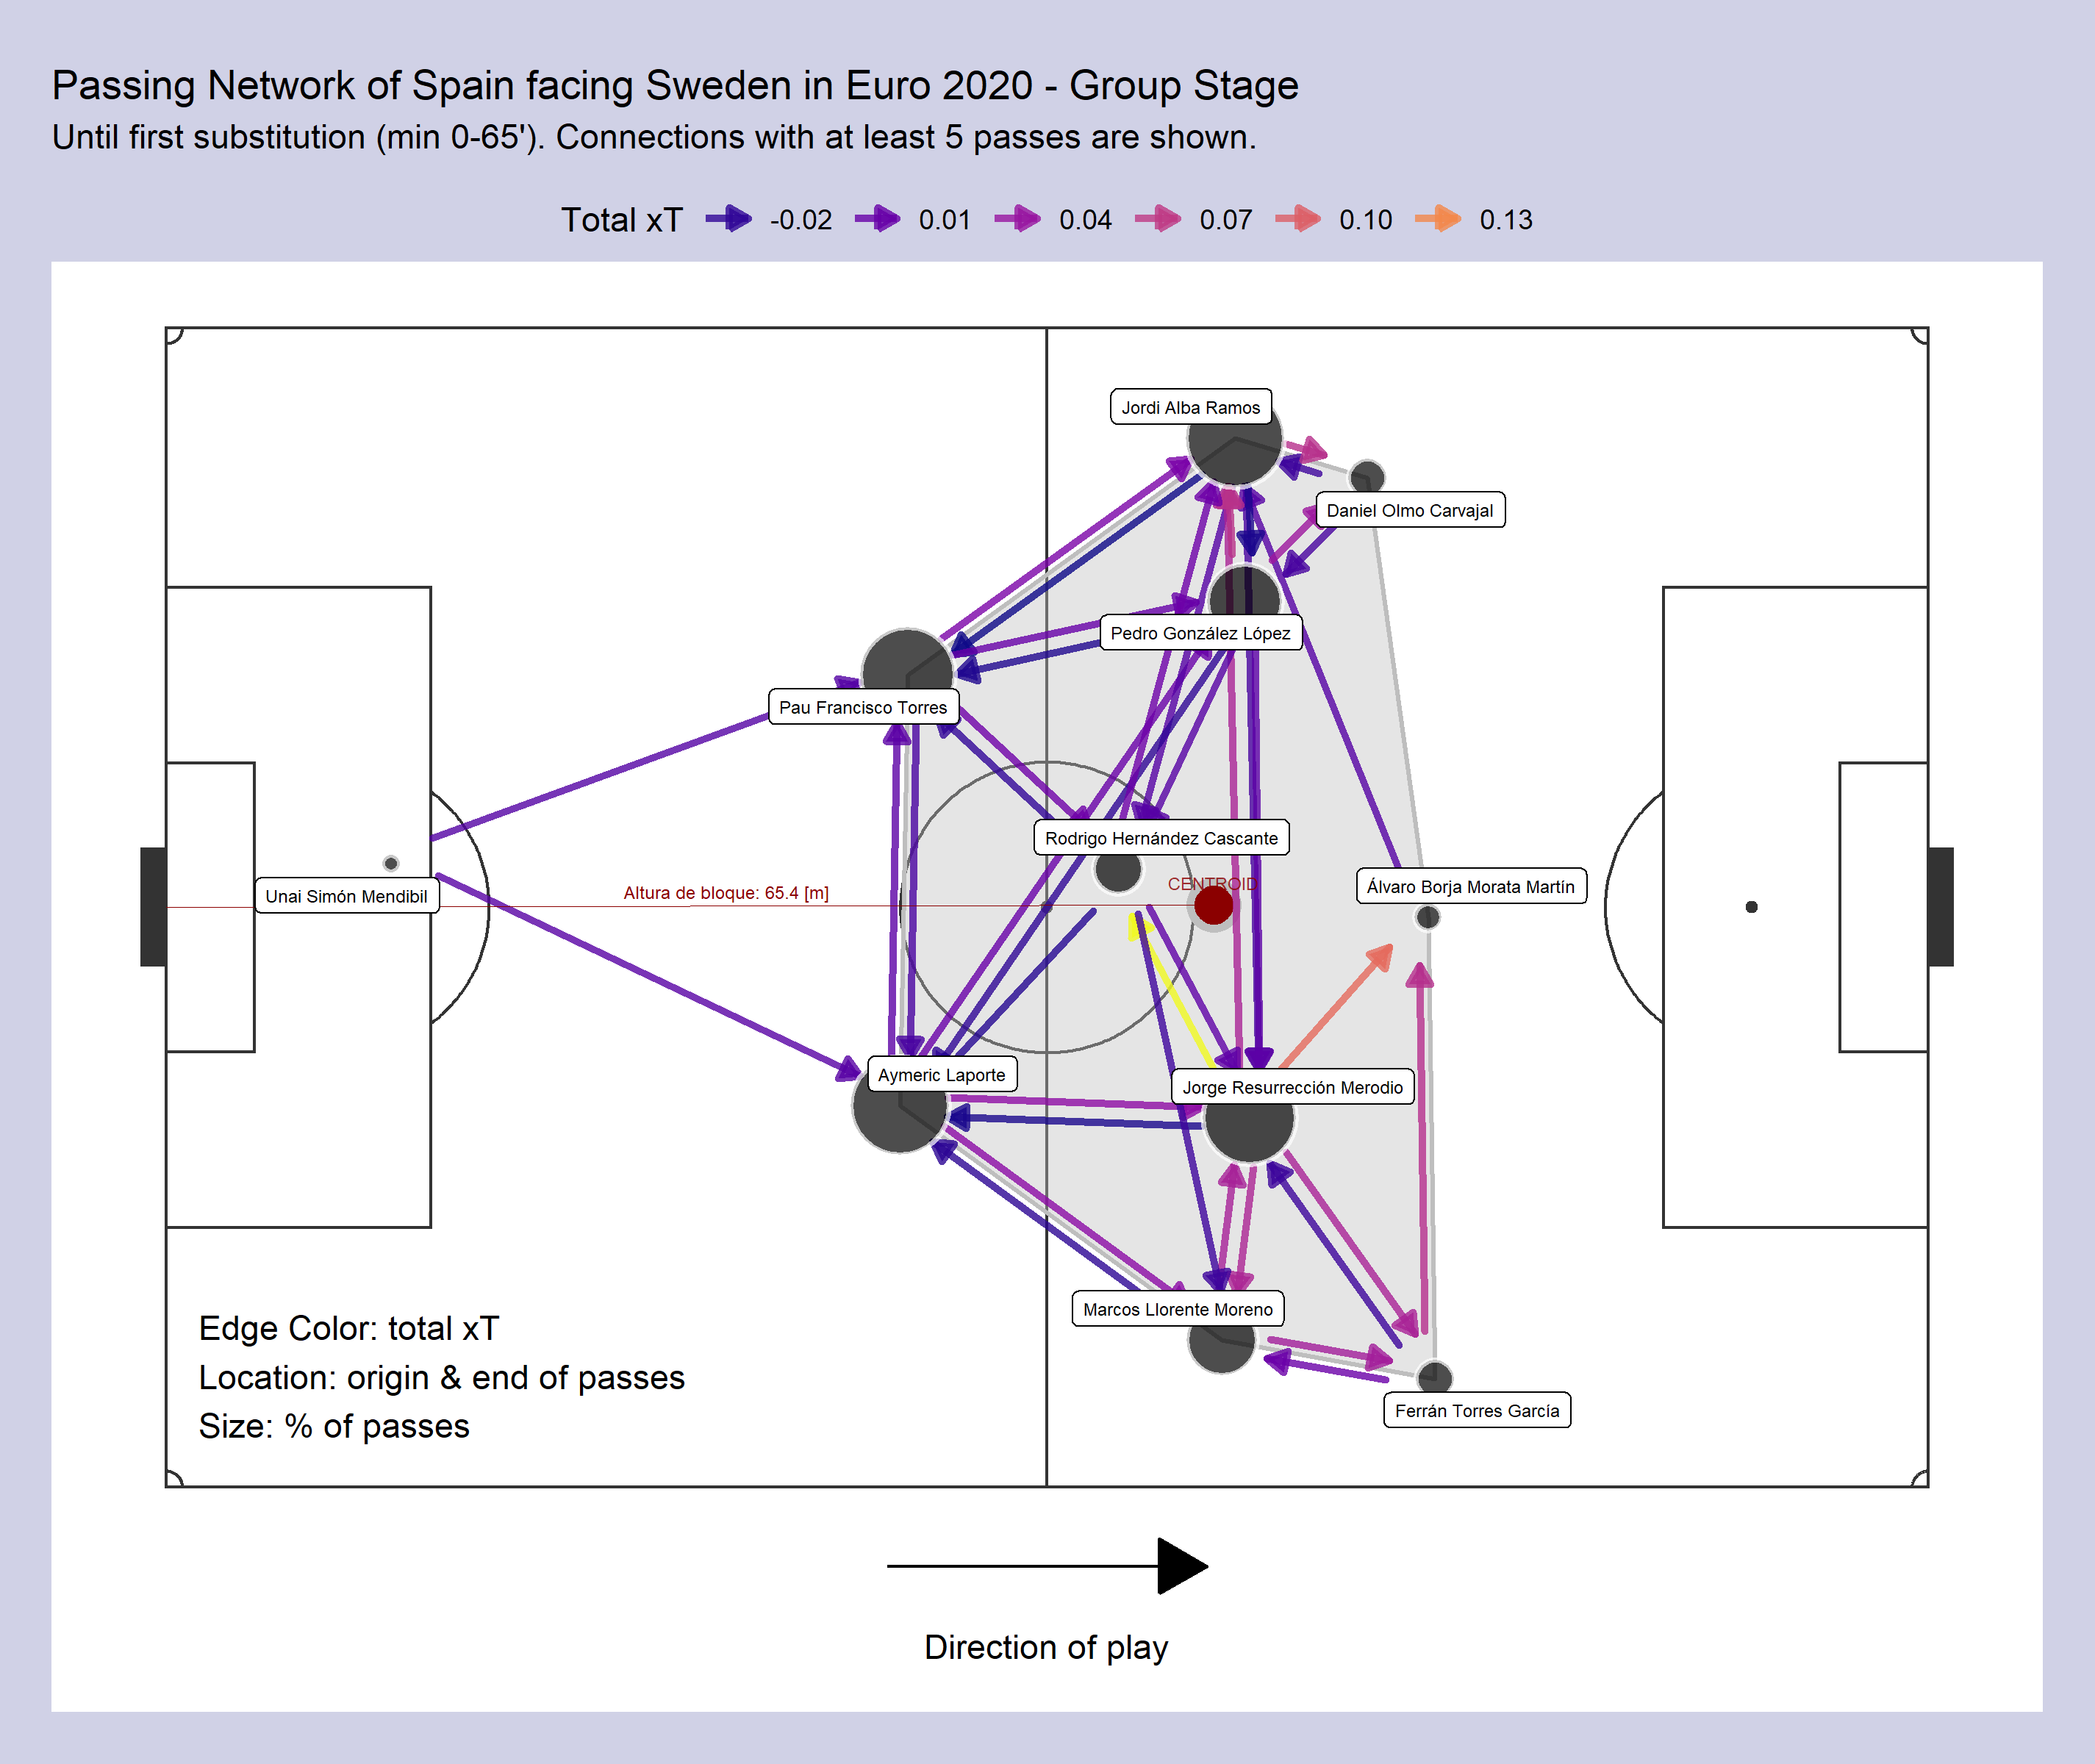
This way you will be able to create visualizations like this:
Finally, don’t forget the StatBombs’s statement about their data usage: “… Whilst we are keen to share data and facilitate research, we also urge you to be responsible with the data. Please register your details here and read our User Agreement carefully.”